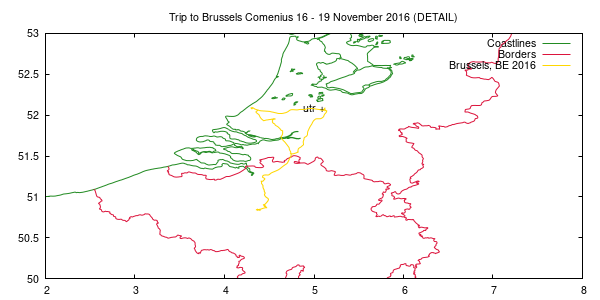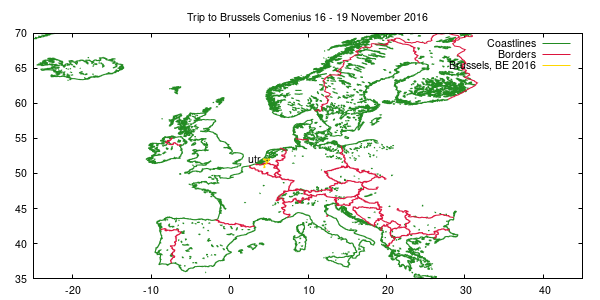
set tit "Trip to Brussels Comenius 16 - 19 November 2016"
set label "utr +" at    5.120324 , 52.08137 right	# Utrecht, The Netherlands
set key

set xrange [-25:45]
set yrange [35:70]
plot 'europe-cil-3-10.dat' t "Coastlines" w l ls 2, 'europe-bdy-3-10.dat' t "Borders" w l ls 1, \
     'namer-cil-3-10.dat' t "" w l ls 2, 'namer-bdy-3-10.dat' t "" w l ls 1, \
     'samer-cil-3-10.dat' t "" w l ls 2, 'samer-bdy-3-10.dat' t "" w l ls 1, \
     '2016-be-12.dat' t "Brussels, BE 2016" w l ls 4