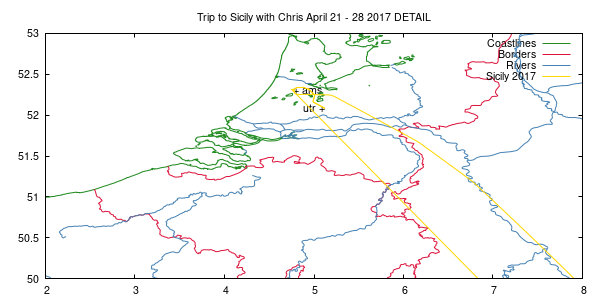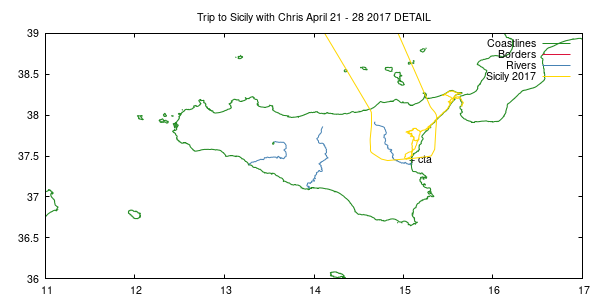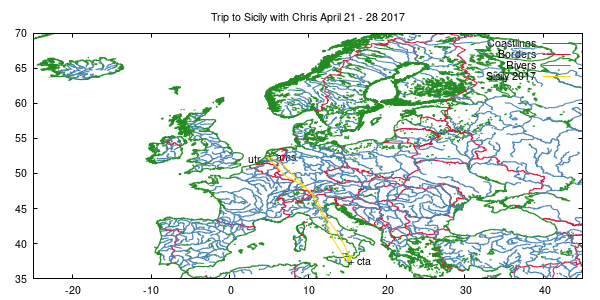
set tit "Trip to Sicily with Chris April 21 - 28 2017"
set label "+ ams" at    4.763385 , 52.30907			# Amsterdam, The Netherlands
set label "+ cta" at   15.0663996, 37.4668007		# Catania, Italy
set label "utr +" at    5.120324 , 52.08137 right	# Utrecht, The Netherlands

set key

set xrange [-25:45]
set yrange [35:70]

plot 'wvs-europe.dat' t "Coastlines" w l ls 2, 'wvs-europe-pol.dat' t "Borders" w l ls 1, 'wvs-europe-riv.dat' t "Rivers" w l ls 3, \
     '2017-it-23.dat' t "Sicily 2017" w l ls 4