Back to trip index

My Trips script: 2018-it-26.plt

autogenerated by webify.pl on Sun Jun 23 14:54:18 2019
gnuplot version gnuplot 5.0 patchlevel 6
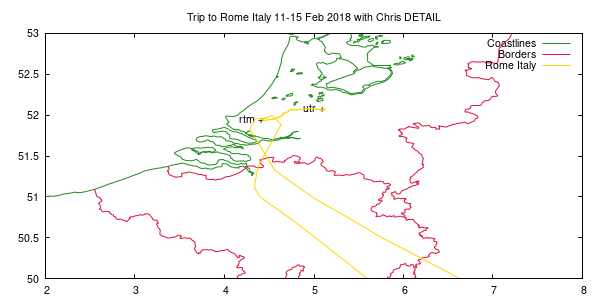
set label "utr +" at    5.120324 , 52.08137 right	 # Utrecht, The Netherlands
set label "rtm +" at    4.4409351, 51.9577434 right	 # Rotterdam, the Netherlands
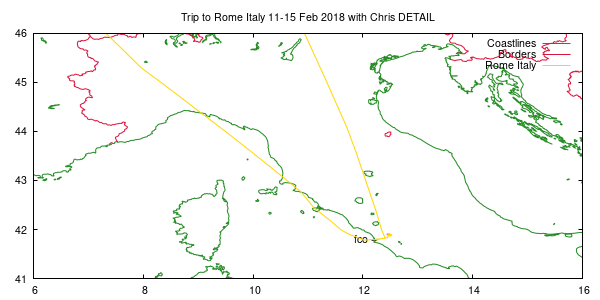
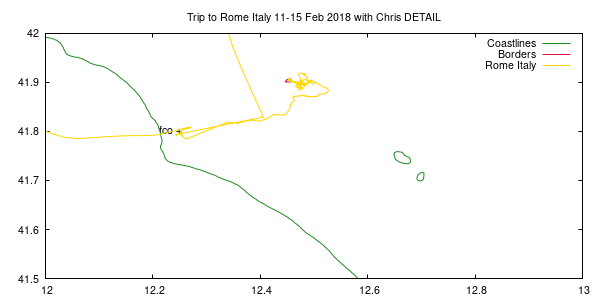
set label "fco +" at   12.2551035, 41.80258 right	 # Leonardo da Vinci International (Fiumicino), Rome, Italy
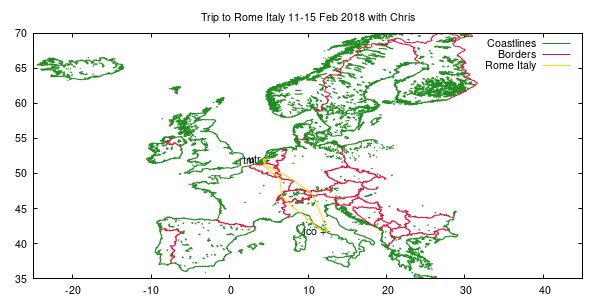
set key


set xrange [-25:45]
set yrange [35:70]

set tit "Trip to Rome Italy 11-15 Feb 2018 with Chris"
plot 'europe-cil-3-10.dat' t "Coastlines" w l ls 2, 'europe-bdy-3-10.dat' t "Borders" w l ls 1, \
     '2018-it-26.dat' t "Rome Italy" w l ls 4 


set xrange [6:16]
set yrange [41:46]

set tit "Trip to Rome Italy 11-15 Feb 2018 with Chris DETAIL"
replot


set xrange [12:13]
set yrange [41.5:42]

set tit "Trip to Rome Italy 11-15 Feb 2018 with Chris DETAIL"
replot


set xrange [2:8]
set yrange [50:53]
set tit "Trip to Rome Italy 11-15 Feb 2018 with Chris DETAIL"
replot


unset label