|
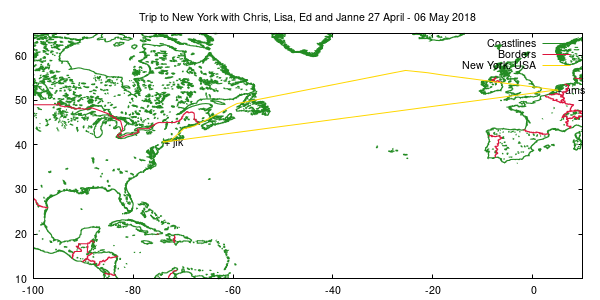
set tit "Trip to New York with Chris, Lisa, Ed and Janne 27 April - 06 May 2018"
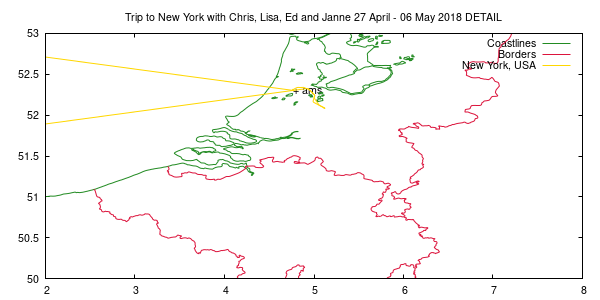
set label "+ ams" at    4.763385 , 52.30907		# Amsterdam, The Netherlands
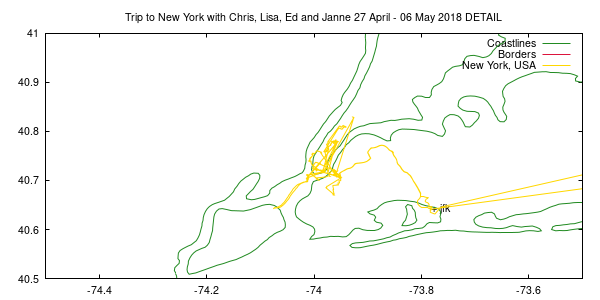
set label "+ jfk" at  -73.7823035, 40.6438436		# John F. Kennedy, New York, New York, USA
set key

set xrange [-100:10]
set yrange [10:65]
plot 'europe-cil-3-10.dat' t "Coastlines" w l ls 2, 'europe-bdy-3-10.dat' t "Borders" w l ls 1, \
     'namer-cil-3-10.dat' t "" w l ls 2, 'namer-bdy-3-10.dat' t "" w l ls 1, \
     'samer-cil-3-10.dat' t "" w l ls 2, 'samer-bdy-3-10.dat' t "" w l ls 1, \
     '2018-us-20.dat' t "New York, USA" w l ls 4
|


