|
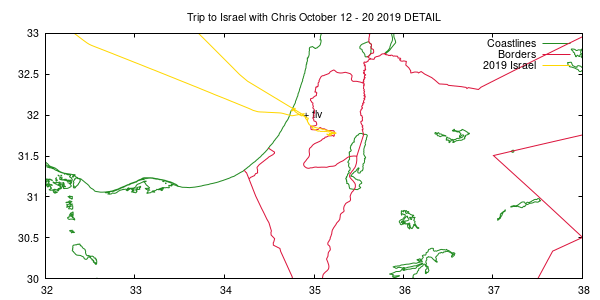
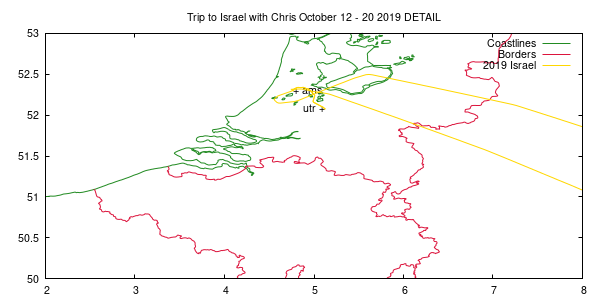
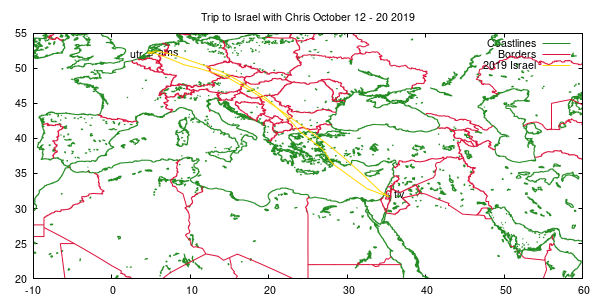
set tit "Trip to Israel with Chris October 12 - 20 2019"
set label "+ ams" at    4.763385 , 52.30907			# Amsterdam, The Netherlands
set label "+ tlv" at   34.882778 , 32.009444  		# Tel Aviv, Israel
set label "utr +" at    5.120324 , 52.08137 right	# Utrecht, The Netherlands

set key

set xrange [-10:60]
set yrange [20:55]
plot 'europe-cil-3-10.dat' t "Coastlines" w l ls 2, 'europe-bdy-3-10.dat' t "Borders" w l ls 1, \
     'africa-cil-3-10.dat' t "" w l ls 2, 'africa-bdy-3-10.dat' t "" w l ls 1, \
	 'asia-cil-3-10.dat' t "" w l ls 2, 'asia-bdy-3-10.dat' t "" w l ls 1, \
     '2019-is-01.dat' t "2019 Israel" w l ls 4
|